Contract research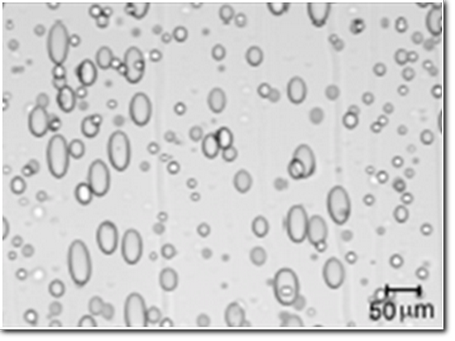
Phase diagrams
Most synthetic polymeric products are produced and processed in liquid systems. The knowledge about the physico-chemical behaviour of the system dependent on pressure, temperature and shear stress is essential for the optimization/improvement of the working conditions. This information can be shown in a phase diagram.
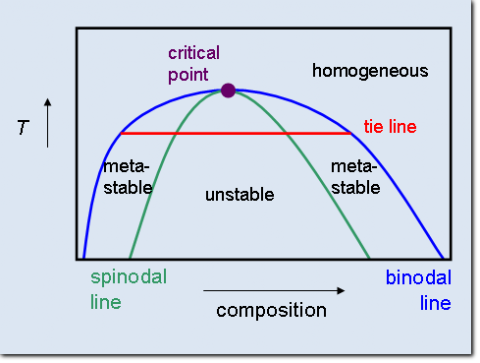
Schematic phase diagram
Phase diagrams under pressure
In industrial practice the solubility of substances in liquid solvents at temperatures above the boiling point, in fluidified or in supercritical gases is of great importance. For the determination of the solubility or of the general phase behavior a pressure cell with sapphire windows is available, where the miscibility can be established.
The Figure shows an example of the solubility of polyethylene in n-hexane at a temperature range of 130°C up to 270°C and at pressures between 20 and 60 bar.
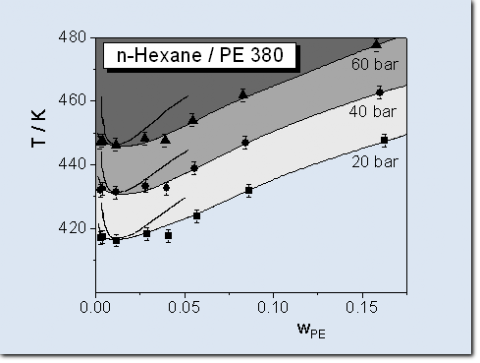
Phase diagram of polyethylene
Phase diagrams under shear
For many applications the phase behavior under shear has a great importance, e.g. homogenous solutions should not phase separate during a mechanical handling, whereupon high shear rates exist.
One can find the phenomenon of the shear induced phase separation or the shear induced homogenization of a two-phase system. That means clear solutions can get turbid by shaking and vice versa.
We are able to determine the phase behavior with two methods. On the one hand we can use an optical shear cell in combination with a microscope. The cell is built up of two parallel polished quartz windows with an gap of 5 mm. The lower windows is included in a rotating metal plate. The windows are close to a block heater, which has a temperature preciseness of +/-0.2°C. The phase behavior can so be determined optical.
Specifications of our measuring system:
- Optical shear cell: CSS 450 (Fa. Linkam Scientific, GB)
- Microscope BX 50 (Fa. Olympus)
- CCD-Camera Jai M 10 (Fa. Jai, Denmark)
- Plate/plate-geometry (Gap: 5-2,500 mm)
- Temperature range: 20 - 450°C
- Shear rate: 0.003-7,500 1/s
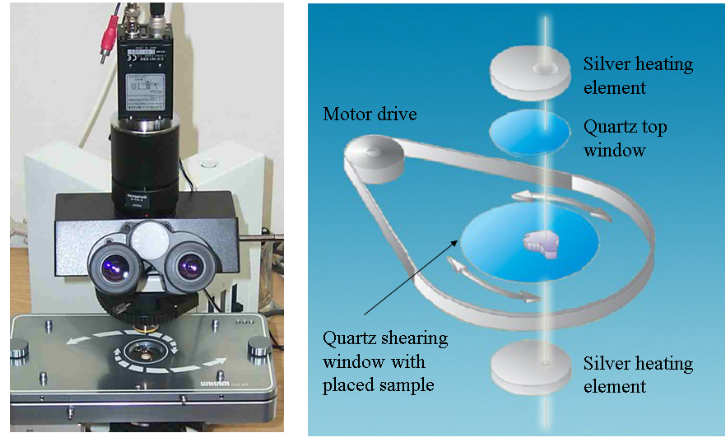
Shear cell with microscope and the schematic set-up of the shear cell
On the other hand the change of the phase behavior of liquid systems can be determined rheological. The measurement of the viscosity as a function of the shear rate (flow curves) can detect phase transitions in the phase diagram as a step wise change of the viscosity. For the determination of the phase diagram the shear rate as well as the temperature and the concentration of the system can be varied.
More information about rheology you can find here.
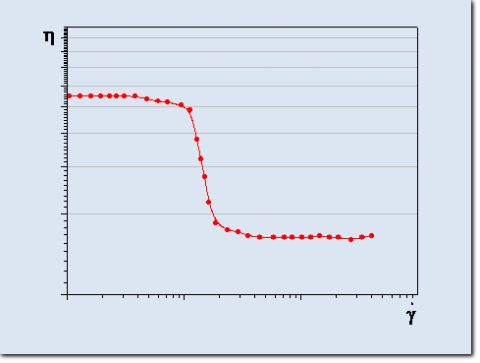
Flow curve with a stepwise change of the viscosity due to a phase transition